Blog: South Asia

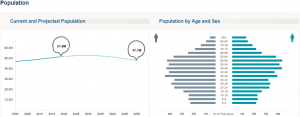
Observing the population pyramid graphs of Mozambique and Philippines you can see that they are both countries with a positive trend. Both of their populations are growing, however Mozambique has a more intensive shape as such it’s growth is much higher. Looking at the forcast, Mozambique’s population will double by 2050 while the Philippines will increase by a factor of 1.5. In relation to the structure of these graphs. The Philippines graph has a plumper shape to it, while Mozambique is sharp and clearly suggest rapid population growth. This places Mozambique in stage 1 and Philippines in stage 2.

Mozambique:
Males per 100 Females: 96.9
People per square kilometer: 38.3
Number of children per woman: 5.0
Current Population: 30.1M
Estimated Population 2050: 63.4M
Philippines:
Males per 100 Females: 100.7
People per square kilometer: 366.2
Number of children per woman: 2.9
Current Population: 109.2M
Estimated Population 2050: 155.4M

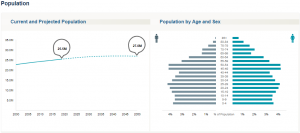
Germany

Males per 100 females: 96.3

People per square Kilometer: 229.9

Number of children per woman:1.5

Current Population 80.2M

Estimated population in 2050: 71.5M

 Japan    

Males per 100 females: 93.9

people per square kilometer: 344.3

number of children per woman: 1.4

current population: 125.5M

Estimated population in 2050: 107.2M


what does the structure of the population pyramids indicates the stage of the population               transition   for each graph and what does it tell you about the death rate and birth rate ?

it tells us that the death rate and the birth rate rise in 2050


For this blog post, I will be comparing the population of Greece and the Netherlands.

Netherlands:

https://www.census.gov/popclock/world/nl

  • Males per 100 Females - 97.8
  • People per sq. km - 509.9
  • Number of children per woman - 1.8
  • Current Population - 17.3M
  • Estimated Population of 2050 - 17.9M


Greece:

https://www.census.gov/popclock/world/gr

  • Males per 100 Females - 95.0
  • People per sq. km - 81.2
  • Number of children per woman - 1.4
  • Current Population - 10.6M
  • Estimated Population of 2050 - 9.2M


Both countries seem to be in stage 4 of the population pyramids with the majority of the population within the working-age/having children. The majority of the Netherlands population is 50-54 with the population leveling out in the 0-4 age group. The majority of Greece's population is also within the 50-54 age group but slow down dramatically over the estimated 30-year span.


The difference when comparing estimated populations for 2050 is dramatic with Greece's population declining by 1.6 million whereas the Netherlands population increasing from 17.3 to 17.9 million. Both countries have similar stage 4 population pyramids. Greece has quite a higher percentage of people in the 80s therefore, more than likely, these peoples in the age group will die off sooner, thus dropping their population greatly.

South Asia Blog
Article:
“Coronavirus in India: Migrants running away from quarantine'
Author:
Geeta Pandey BBC News, Delhi
URL: https://www.bbc.com/news/world-asia-india-52276606
This BBC article written by Greeta Pandey pulled my eye in because I was not aware of how India was trying to handle the COVID-19 pandemic and how they were actually trying to wrangle it in. As Pandey explains, after India’s Government implemented a lockdown due to COVID-19 in efforts to slow the spread, hundreds of thousands of migrant workers fled major cities like Delhi to rejoin their families and return home to the northern states of Uttar Pradesh and Bihar. In response these State governments implement mandatory quarantine mandates and set up quarantine facilities in local government buildings such as council buildings and schools, for screening, holding and treating these returning migrant workers. Public concern continues to grow in both of these provinces as these efforts seem to be fighting a losing battle. Migrants are escaping quarantine facilities, ignoring quarantine orders all together, and continuing to visit and travel around public areas. This has raised concerns within the local communities due to the high population density already present within these states. Returning migrant workers are leaving these quarantine facilities due to the conditions and lack of basic necessities, with reports of some not having electricity, water or bathrooms. 16 people broke a window to get out of one facility in Uttar Pradesh including men, women, and children, later claiming on a video that they were not given food. Many of these travelers who have escaped complain of poor conditions and facilities, and overcrowding. Given the current situations it seems like the government has an uphill battle. Reading about the numbers of migrant workers, coming into these states, as well as their total numbers in the major cities, makes me think of how hard it would be to tackle trying to track and handle COVID-19 cases. Especially with the movement of all these people and issues surrounding facilities, and people wanting or needing to find work, after being jobless in a city, traveling back to an area with even less opportunity.

Madagascar

Males per 100 females — 100.0

People per square kilometer — 45.3

Number of Children per Woman - 3.9

Current population — 26.3 mil

Estimated population — 45.8 mil


Venezuela

Males per 100 females — 99.0

People per square kilometer — 32.5

Number of Children per Woman — 2.3

Current population — 28.7 mil

Estimated population — 36.2 mil


Comparing the two, it looks like Venezuela is more of a cone shape, with little population difference between age groups (though there is a population drop in those aged 15-24, possibly due to emigration. Meanwhile, each age group in Madagascar is much larger than the group above it, probably due to the incredibly high birth rate (3.9??). That may be why Madagascar is expecting about an 80% population increase in thirty years as opposed to Venezuela’s 25%.


The two countries I have chosen to compare are Haiti and Dominican Republic.

Haiti:

97.7 males per 100 females
396.6   people per sq. km
2.6 children per woman
10.9M population
14.5M estimated population 2050

Dominican Republic

102.3 males per 100 females
215.2 people per sq. km
2.3 children per woman
10.4M population
12.5M estimated population 2050

The population graph for both these countries are very similar and show that there is a higher birth rate for both countries. The population for the age groups from 0-24 remain similarly the same percentage of the population, then it slowly declines evenly to make a pyramid. The percent of the population for age groups in 40-80 are slightly higher for the Dominican republic, which shows they have a lower death rate and an overall higher average life expectancy.

The current population for these two countries are off by only half a million, but the estimated population by 2050 is 2M higher for Haiti. This is reflected in the population pyramid because the birthrate is higher, meaning their population will grow more than the Dominican republic by 2050.


https://www.nytimes.com/interactive/2020/04/09/world/asia/coronavirus-hong-kong-singapore-taiwan.html

Why Coronavirus Cases Have Spiked in Hong Kong, Singapore, and Taiwan

This article contains information on a spike in coronavirus cases in the countries of Hong Kong, Singapore and Taiwan, with the first cases coming from Wuhan, China these countries have began to notice that new cases are more commonly linked to imported cases such as students, tour groups, and migrant worker than local transmissions. A geographical concepts that could be that a majority of the Taiwan population is Chinese and Taiwan is also described as an asian tiger which means that Taiwan's growth is mainly in exports but with sophisticated finance and trade. These two can be an way to explain what the travel to Taiwan could be for and why cases have increased due to outside sources.

For this Blog I chose North and South Korea. My husband is half South Korean so this location naturally sparked my interest. Then of course learning about North Korea is very interesting from a political stand point.

As you can see from the population pyramids, both countries show a low death and a low birth rate. North Korean seemed to fluctuate frequently and I almost mistook it for a developing country Stage 2. However the recent low birth rates show more of a Stage 4.

South Korea is a clear Stage 4 depicting low death and low birth rates.

North Korea's 2050 populate is right in line with the projection of 27 million. The country seems to have what's called a stable population which is in line with this number. South Korea projects a decline of almost 4 million which is in line with the historical date.


North Korea:
https://www.census.gov/popclock/world/kn
- Males per 100 Females — 94.4
- People per square Kilometer — 211.9
- Number of Children per woman - 1.9
- Current Population — 25.5 million
- Estimated Population of 2050 - 27 million


South Korea:
https://www.census.gov/popclock/world/ks
- Males per 100 Females — 100.4
- People per square Kilometer — 532.8
- Number of Children per woman — 1.3
- Current Population — 51.6 million
- Estimated Population of 2050 — 47.7 million

Thank you,

Christina Love

I chose to compare: Malaysia and Australia

Malaysia:

Males per 100 Females: 102.6

People per sq. km: 98.1

Children per woman: 2.5

Current population: 32.2 Million

Estimated population 2050: 42.9 Million


Australia:

Males per 100 Females: 98.8

People per sq. km: 3.3

Children per woman: 1.7

Current population: 25.1 Million

Estimated population 2050: 32.5 Million

Pyramids:

Malaysia's population pyramid has the highest numbers in the children ages from 0-14 years old before steadily declining. It's around the ages of 50 and up that the numbers begin to shrink which seems pretty normal in my opinion as this means a high birth and mortality rate for the youth but as people get older things like accidents, illness and more are affecting young adults and the elderly people.

Australia's population pyramid differs from Malaysia as their numbers peak at the population age of 25 before fluctuating and decreasing numbers as the population gets older. Between the ages of 0-15 years old being compared to Malaysia's pyramid are much smaller which has me believe that their could be lower birthrates or virus/diseases that may be hitting the youth much harder impacting that age group population numbers.

The overall population prediction for 2050 is a fairly big gap for Malaysia and Australia as Malaysia's population is predicted to grow around 10 million more in 2050 while Australia is predicted of a growth of 7 million difference by 2050. This is to be expected as Malaysia has higher numbers in the birthrates while Australia has greater numbers in their middle age group.

For this blog post, I decided to compare the population Geography of Germany and France.

Germany:
https://www.census.gov/popclock/world/gm

  • Males per 100 Females - 96.3
  • People per square Kilometer - 230.3
  • Number of Children per Woman - 1.5
  • Current Population - 80.3 million
  • Estimated Population of 2050 - 71.5 million

France:
https://www.census.gov/popclock/world/fr

  • Males per 100 Females - 95.6
  • People per square Kilometer - 105.6
  • Number of Children per Woman - 2.1
  • Current Population - 67.6 million
  • Estimated Population of 2050 - 69.5 million


4. The structure of the population pyramid of France seems to be more equally distributed than in Germany. In addition, the birth versus death rate in France is more equal based on the number of young people compared to elderly people. The difference in these rates is 2% for males and 0.7% for females. On the other hand, the death rate is lower than the birth rate because the distribution for Germany has a denser population for the older generations. Overall the distribution for Germany peaks at the ages of 50-60, while in France the graph is roughly evenly distributed throughout.

5. There is a major difference when comparing the estimated populations for 2050. In Germany, the population is going to decrease by a significant number of over 10 million people. However, in France the population is going to increase by about 3 million people.
In Germany, the population consists of mainly people over 45 years old. Therefore a higher percentage of the population will die sooner. In comparison, France has a more even distribution. Therefore because the number of people that die does not exceed the number of people that are born the population will increase.